Analysis→Basic→Modified t-Test for Correlation
This procedure calculates Pearson’s product-moment correlation between two variables and tests its significance using the procedure of Clifford, Richardson, and Hémon (1989) (CRH). In most cases involving spatial data, standard statistical testing is not valid because the assumption of independence of samples is often violated. Failure to account for non-independence of samples results in pseudoreplication, inflating sample sizes and the degrees of freedom. The CRH test corrects the degrees of freedom, based on the amount of autocorrelation in the data, using Moran’s I to estimate the spatial autocorrelation in the data sets. The corrected degrees of freedom are then used to test the significance of the correlation.
The original CRH procedure is based on a variance approximation. Dutilleul (1993) found an exact solution that is more computationally intensive, particularly with larger data sets. The difference between the CRH and Dutilleul results tends to be very small.
| Menu: | Analysis→Basic→Modified t-Test for Correlation |
| Button: | |
| Batch: |
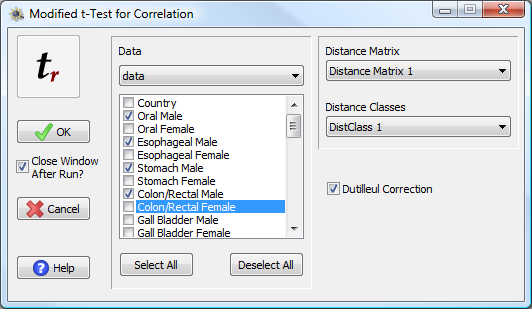
The Modified t-Test window.
To run this procedure, you must specify a data matrix and at least two columns of data to correlate. If more than two columns are chosen, all possible pairs of columns are tested. You must also specify a geographic distance matrix and distance classes for the estimation of the spatial autocorrelation in the data. You may optionally choose whether to include the Dutilleul correction.
There will be one line for each pair of variables examined. Each line lists the variables, the covariance and its significance, the correlation and its conventional significance, the corrected significance, and the effective sample size. The final column indicates changes in significance based on the relative conventional and corrected P-values. If the Dutilleul correction is included, three additional columns showing the Corrected P, Sample Size, and change in significance are included as well.
The following was an analysis of the correlation among mortality rates for four of the cancers.
Modified t-test for Correlation
Number of Variables: 4
Number of Localities: 355
------------CRH------------ ---------Dutilleul---------
Conventional Corrected Effective Corrected Effective
Variable 1 Variable 2 Covariance P(Cov) Correlation P(Cor) P(Cor) Sample Size +/- P(Cor) Sample Size +/-
Oral Male Esophageal Male 3.15144 0.00162 0.82535 0.00000 0.00011 15.57963 0.00006 16.46433
Oral Male Stomach Male -0.34259 0.73191 -0.08083 0.12850 0.74247 18.96424 0.73658 19.75567
Oral Male Gall Bladder Male -0.88871 0.37416 -0.22426 0.00002 0.39175 16.70397 - 0.37714 17.60532 -
Esophageal Male Stomach Male -0.35728 0.72088 -0.07215 0.17498 0.72883 25.52159 0.72326 26.51842
Esophageal Male Gall Bladder Male -1.06841 0.28534 -0.22900 0.00001 0.29599 22.76699 - 0.28175 24.00093 -
Stomach Male Gall Bladder Male 0.81392 0.41569 0.16389 0.00195 0.42704 25.66357 - 0.41787 26.59790 -
+ = Gain of Significance
- = Loss of Significance
The Modified t-Test output. The first two columns list the variables being compared. The third and fourth columns contain the covariance of the variables and its significance. The fifth and sixth columns contain the correlation and its significance, as determined from a conventional (non-spatially corrected) test. The next three columns list the corrected P-value, the effective sample size, and whether or not the significance changed when the CRH test is applied. When applicable, the last three columns show the same information when the Dutilleul correction of the original CRH test is conducted. In the above example, three correlations which were significant using a conventional test were found to be non-significant after correction.