Dimensions
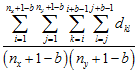
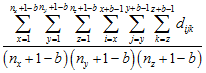
First Moment μ1(b)
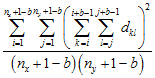
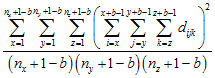
Second Moment μ2(b)
1


2
3
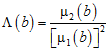
Lacunarity analysis derives from fractal mathematics and is a measure of the distribution of gap sizes (Plotnick et al. 1993). Originally developed for binary (presence/absence) data, lacunarity analysis is easily applicable to continuously distributed variables as well (Plotnick et al. 1996). Lacunarity for a specific range (scale) is estimated as the ratio of the first and second moments of counts within all possible boxes of that range width.
The first moment is the average sum of values in all possible blocks of size b, while the second moment, is the average squared sum of values in all possible blocks of size b.
Dimensions |
First Moment μ1(b) |
Second Moment μ2(b) |
1 |
|
|
2 |
|
|
3 |
|
|
The lacunarity for scale b is then measured as:
 .
.
Lacunarity analysis is very similar to many dispersion indices, because by substitution and rearrangement, the lacunarity equation can also be written as
 ,
,
which is very similar to the Index of Dispersion and related metrics (Dale 2000; Dale et al. 2002; Plotnick et al. 1996).
Lacunarity is usually plotted on a log-log plot of Λ versus scale. The interpretation of a lacunarity plot is somewhat more complicated than in the other transect methods. Random data produces a curve which is concave upwards. Clumped data produces greater lacunarity and a curve which is concave downwards. Regularly spaced data produces less lacunarity and a curve which is initially straight. Plotnick et al. (1993; 1996) and Dale (2000) both discuss the interpretation of lacunarity curves with examples. Dale (2000) suggests an alternative method for plotting lacunarity curves which aids in interpretation; this method is not included in PASSaGE because it assumes binary data.
| Menu: | Analysis→Contiguous Data→Lacunarity Analysis |
| Button: | |
| Batch: | Lacunarity |
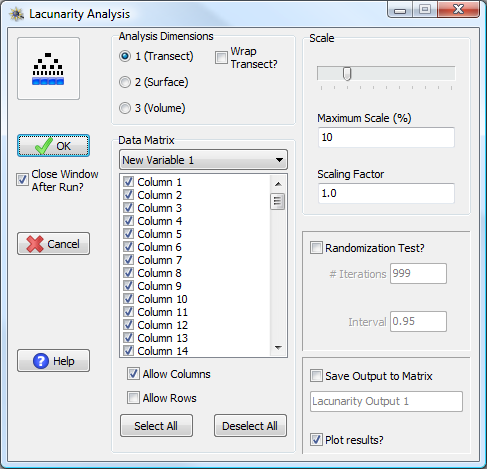
Lacunarity Analysis window
To run a lacunarity analysis in PASSaGE, one must first specify the dimensionality of the analysis they wish to run. One dimensional analyses have an additional option known as Wrap Transect? If this box is checked, PASSaGE will assume that the ends of the transect meet in a circle and calculations are adjusted to account for the adjacency of the endpoints. This option should be used for circular data with arbitrary endpoints (e.g., an analysis of data from a circular chromosome).
One must also specify a data matrix from which to extract data for the analysis as well as the specific data to extract. The specific options depend on the dimensionality of both the analysis and the input data. PASSaGE allows one to perform lacunarity analysis on multiple data sets simultaneously by choosing multiple columns (and/or rows or surfaces) from a single input matrix.
Lacunarity analysis is performed for all scales (block sizes) from one to a maximum specified as a percentage of the input data size. The maximum allowable scale is 50%.
Randomization tests for lacunarity analysis work by randomizing the order of the quadrats within the transect (or surface or volume) and recalculating the lacunarity profile for the randomized data. This generates a null distribution of expected lacunarity indices for data with the specific observed values but with no specific geographic relationships. Significant lacunarity indices can be identified from the observed data when the observed values fall outside the expectation generated from the randomization test. Lacunarity analysis is two-tailed.