This procedure calculates a distance matrix from one or more columns of a rectangular data matrix. The result is an n × n distance matrix, where n is the number of data points (equal to the number of rows in the input matrix). Each value in the output matrix, dij, is a measure of the distance between the ith and jth rows.
| Menu: | Create→Distances→Distances for Data |
| Button: | |
| Batch: | DataDistances |
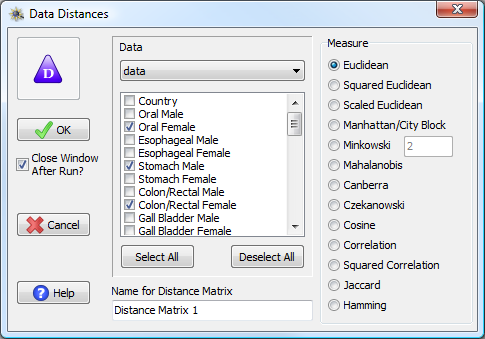
The Make Distances from Data window.
PASSaGE allows you to choose from among many distance measures. In all of the following i and j refer to rows of the data matrix, m refers to the number of columns (variables), while xik refers to the value in the kth column of row i to be included in the distance measure.
The straight-line measure through multivariate space between the data points.
![]()
The square of the straight-line measure through multivariate space between the data points.
![]()
Similar to the Euclidean distance except that each variable is scaled by its variance, s2.
The sum of the absolute difference between the points in each individual dimension.
![]()
A general distance measure, which includes an additional parameter λ. Increasing λ has the effect of exaggerating more dissimilar values relative to more similar values.
Euclidean and Manhattan/City Block distances are special cases of the Minkowski distance when λ = 2 and 1, respectively.
A common multivariate distance measure where
![]()
In this case xi and xj are the vector columns representing points i and j and S is the sample variance-covariance matrix.
This is 1 – the correlation of the variables, or
It is useful when a correlation coefficient of –1 represents the maximum disagreement between the two variables.
This is 1 – the squared correlation of the variables, or
It is useful when the sign of the correlation is unimportant and correlation coefficients of +1 and –1 are treated as logically identical, showing maximum agreement between the variables.
The proportion of values that differ between the two points. Useful for categorical data.
![]()
Similar to the Hamming distance, but only cases where xik and xjk are not both zero are counted.