Coordinate matrices have an internal study plot associated with them, describing the shape and size of the area in which the points are assumed to fall. Study plots are used by certain analyses to estimate the study area or to correct for edge effects. By default, the study plot of imported coordinate matrices is assumed to be rectangular and defined by the minima and maxima values along each coordinate axis.
When Matrix is Chosen in the Data Monitor
| Menu: | Data→Manipulate→Set Study Plot |
| Button: | |
| Batch: | SetStudyPLot |
Options for setting the study plot depend on the dimensionality of the coordinates. In general, the “Set to Default” button creates a rectangular study plot whose extent is defined by the minima and maxima values along each axis. The “Reset” button will revert an altered study plot to its original form. Changes are not stored until the “OK” button is pressed.
For one-dimensional data, the study plot simply consists of a pair of coordinates representing the endpoints of the plot. The plot shape can be rectangular, indicating a simple line segment, or ellipsoid, indicating that the ends of the study plot meet (i.e., the transect is circular).
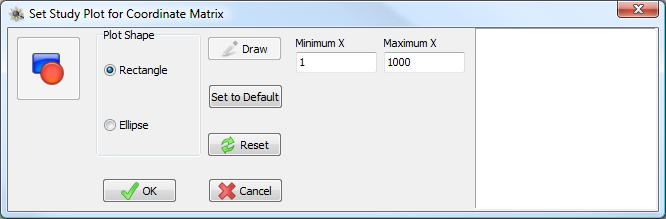
Set Study Plot for Coordinates Matrix window for one-dimensional data.
For two-dimensional data, study plots can be rectangular, elliptical, or polygonal. Rectangular plots are defined by the minima and maxima values along each axis. Elliptical plots are defined by the origin of the ellipse and the radius along each axis. A polygonal plot is defined by a polygon matrix. Once a polygon is attached to a coordinate matrix as a study plot it can be removed from memory (the polygons making up the study plot are stored independently of the actual polygon matrix originally used to define the study plot).
For two-dimensional data, pressing the Draw button will optionally display an image of the coordinates and the currently defined plot in the right hand side of the window.
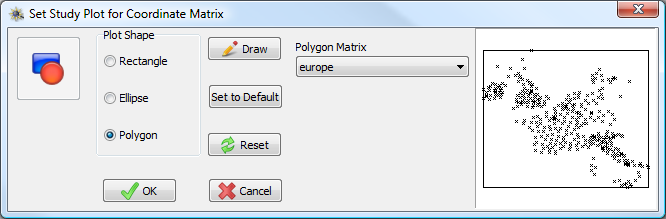
Set Study Plot for Coordinates Matrix window for two-dimensional data.
(A) (B)
(B) (C)
(C)
Examples of two-dimensional study plots. (A) Rectangular plot based on the minima and maxima of the points; (B) Elliptical plot; some of the points fall outside the plot boundary; (C) Polygonal plot with poorly defined shape; PASSaGE will have problems estimating aspects of this plot, such as area.
For three-dimensional data, study plots can be rectangular or elliptical, defined in the same manner as two-dimensional data. Polygonal plots are currently not an option in three-dimensions.
(A) 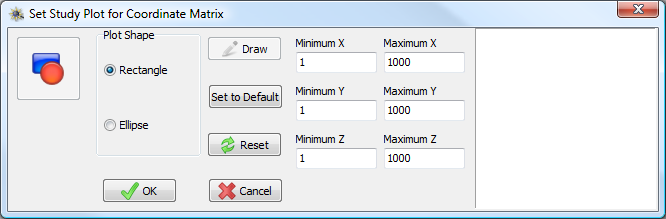
(B) 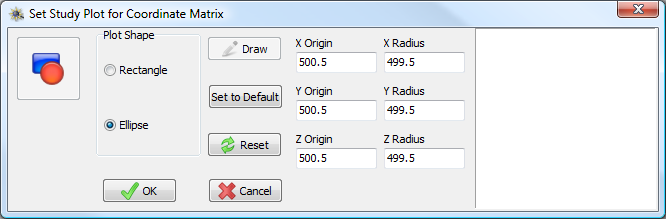
Set Study Plot for Coordinates Matrix window for three-dimensional data. (A) Rectangular plot options; (B) Elliptical plot options.